Pricing Chart
Price charts represent the price action of a trading asset for analysis and decision making and come in many different forms. A chart, or more specifically, a price chart, happens to be the first tool that every trader using technical analysis needs to learn. Forex charts are a vital tool for both technical and fundamental traders.
A chart is simply a visual representation of a currency pair’s price over a set period of time. Charts are user-friendly since it’s pretty easy to understand how price movements are presented over time. With a chart, it is easy to identify and analyze a currency pair’s movements, patterns, and tendencies.
On the chart, the y-axis (vertical axis) represents the price scale and the x-axis (horizontal axis) represents the time scale. Prices are plotted from left to right across the x-axis. The most recent price is plotted furthest to the right.
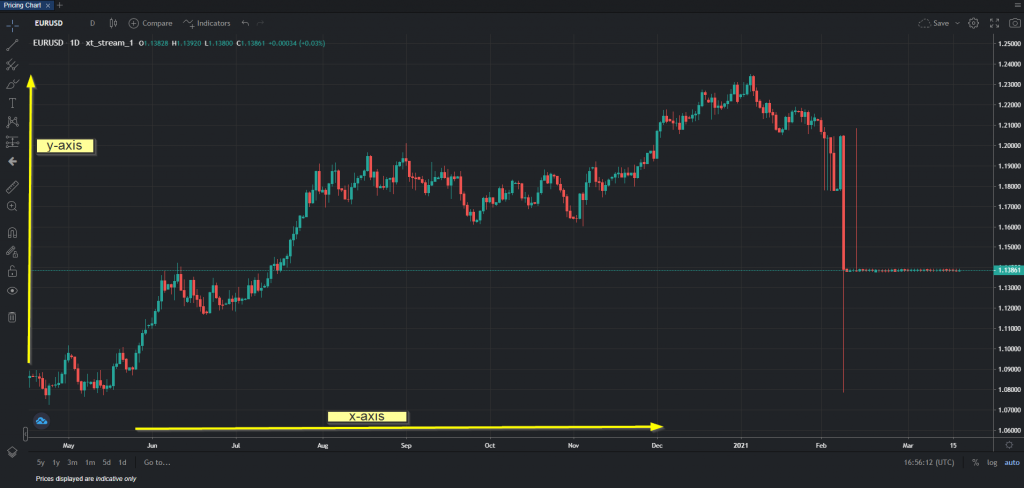
A forex price chart is the basis of online financial asset trading. It gives a graphical picture of the prevailing prices of underlying assets in real-time. Forex charts are a vital tool for both technical and fundamental traders.
Chart Types
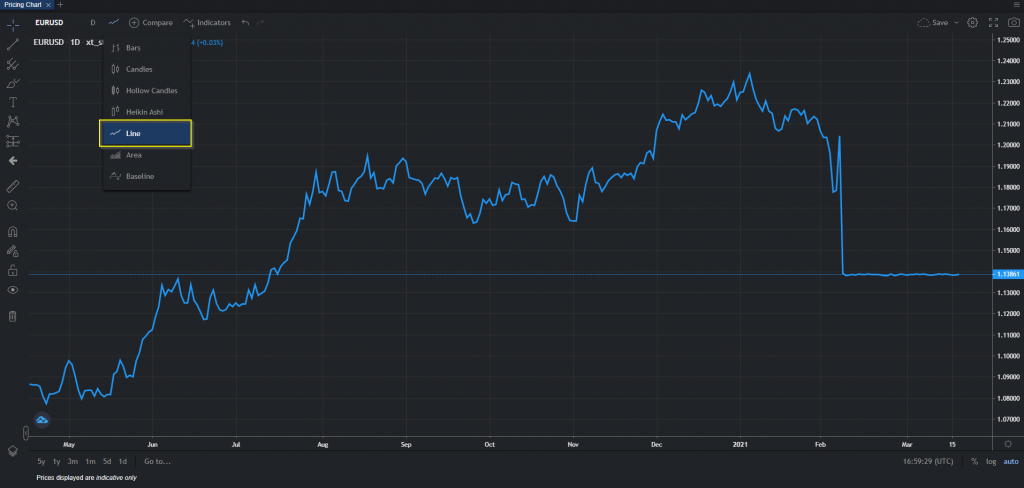
There are 3 main types of forex charts: line, bar, and candlestick charts. Line charts are plotted using the closing prices of the underlying financial asset over a period of time. Line charts smooth out the price action of an asset and are ideal for mapping out definitive support and resistance price points.
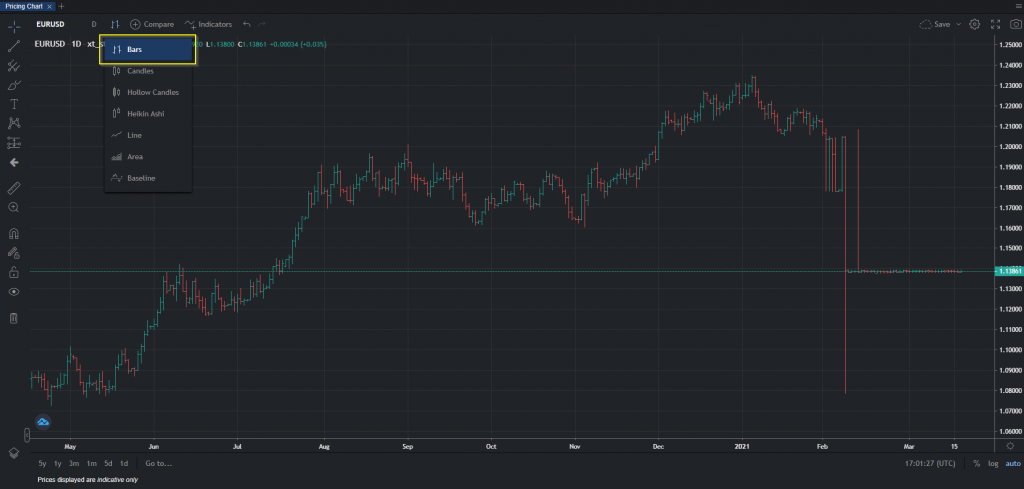
Bars and candlestick charts are time-based as well, but they provide more detailed price information on the underlying asset. In addition to closing prices, these charts also display the high, low, and open prices of an asset during a particular time period.
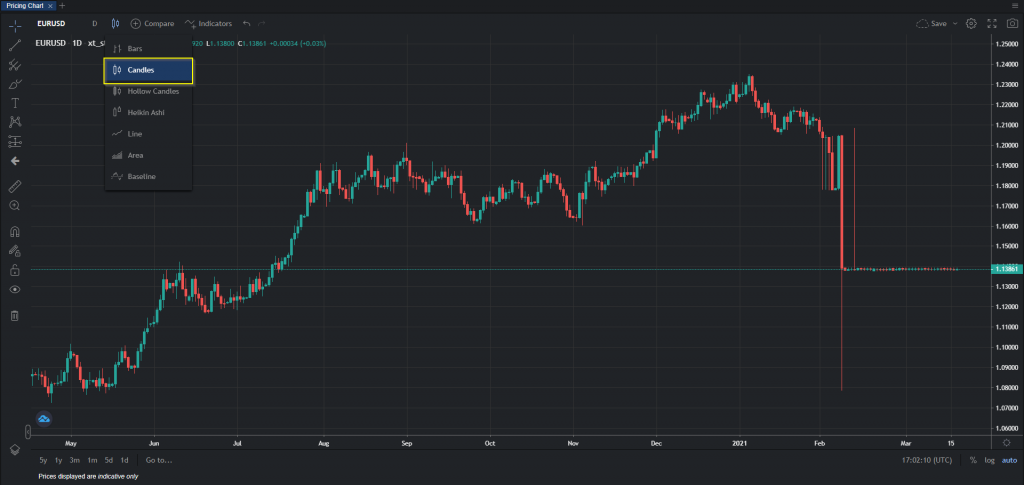
Candlestick charts are basically the standard in most online brokerage firms because of their visual appeal and relatively easy analysis. Technical analysts watch various candlestick forms and patterns that provide different bullish and bearish signals when trading their preferred assets.
Timeframes
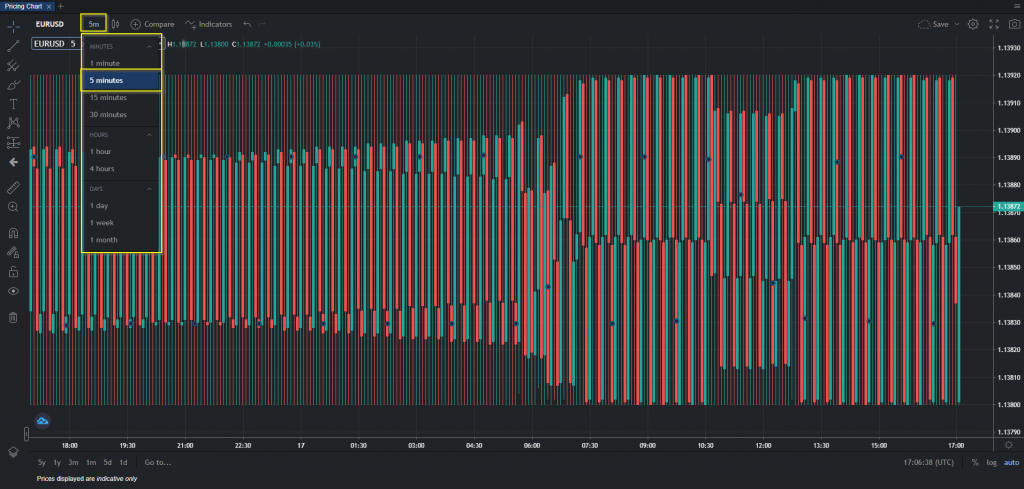
A forex chart plots two key asset variables: price and time. Forex traders can choose the timeframe they wish to watch the price action of their selected assets. There are different timeframes, such as 5-minute, 15-minute, 4-hour, daily, and weekly charts. If, for instance, you choose a 5-minute chart, a candlestick (with all the relevant price information) will form every 5 minutes.
Price Analysis
The main reason to read a forex chart would be to perform the price analysis of an asset you wish to trade. By using graphical objects, such as lines and channels, traders can map out support and resistance levels so as to trade ranging markets more efficiently.
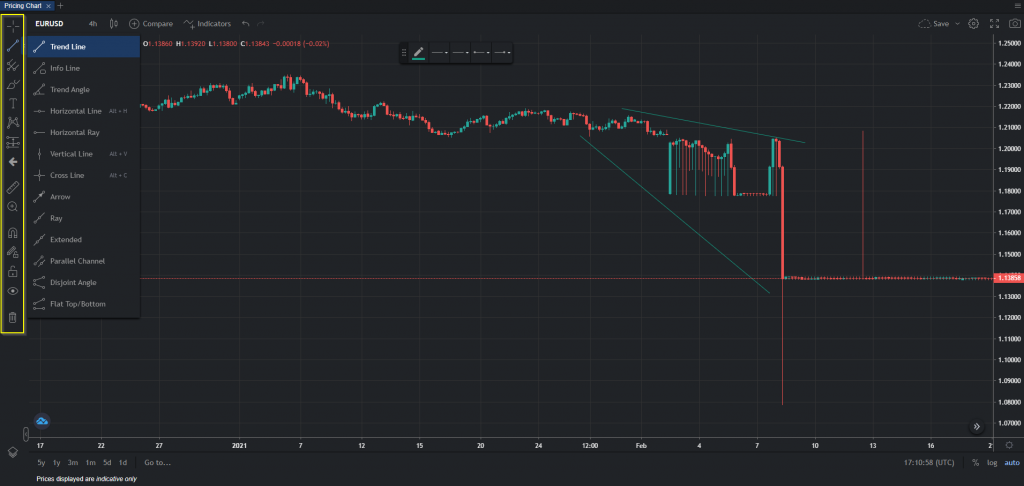
Aside from trend direction, there are other indicators that can be applied to help gain more price understanding. These include momentum indicators such as stochastics; volatility indicators such as Bollinger Bands; volume indicators such as Volumes; and market cycle indicators.
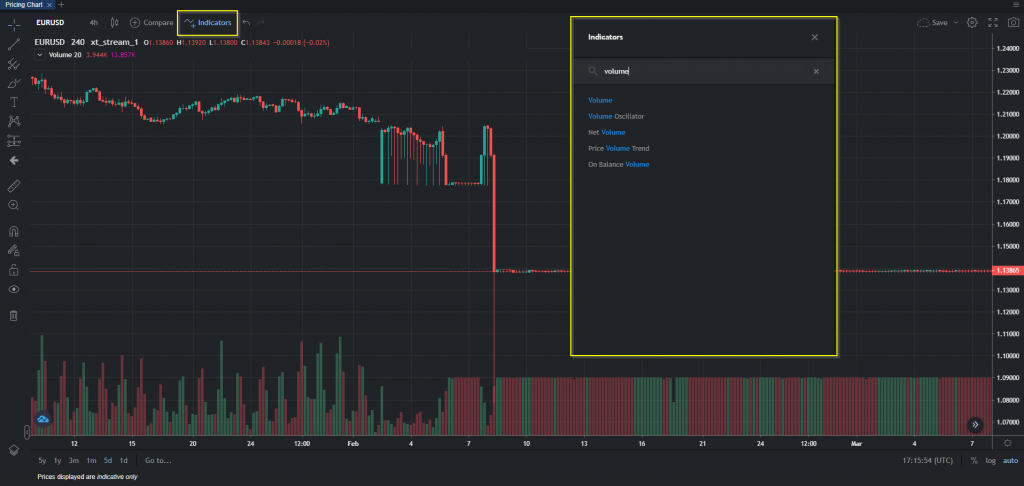
A chart allows for extensive price analysis using various trading indicators and tools.
Note: The prices that are shown in the pricing chart component are indicative only.