Book Depth Chart
The Book Depth Chart component presents a visualization of the order book which can be used to study the order book quickly while trading. The top of the order book is always toward the center of the chart. The actual center of the depth chart indicates the midpoint between the highest bid and lowest ask.
The book depth chart gives you an instant idea about the supply and demand situation.
A book depth chart is a typical graph with an X (horizontal) and Y (vertical) axis where the x-axis represents price movements and the y-axis represents the volume.
- When changing a symbol, the graph changes only when there is an update on the new symbol book
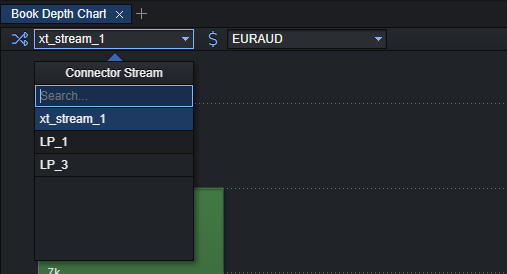
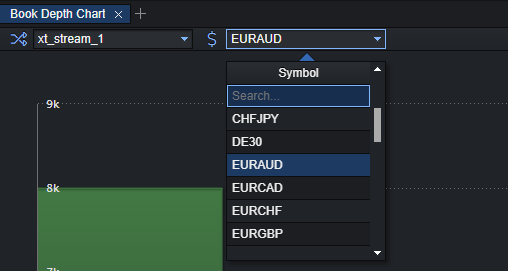
You can select a specific connector stream in case there are multiple pricing streams under one connector and then quickly change between the symbols.